– Policy Brief
Aim. Since the beginning of the second wave of covid19, the number of non-covid19 patients in intensive care units has decreased from a baseline of 650 patients to a minimum of 302 patients (15.11.2020). Elective procedures have been delayed in multiple cantons. During non-epidemic periods, elective procedures are expected to account for 30-35% of ICU occupancy (Thierry Fumeaux, personal communication). However, in Switzerland, the attendance of ‘usual’ ICU patients has declined further than this threshold (Figure 1). Decline in attendance of ICUs by ‘usual’ patients, and inability to admit all covid19 patients due to local saturation may have long-lasting consequences on the health of the population. Here we aim to quantify the burden associated with operating near intensive care saturation during the covid19 epidemic in Switzerland.
Hypotheses. We hypothesize that operating near saturation has resulted in a double burden of patients that do not appear in epidemiological data but can nevertheless be estimated. Non-covid patients whose procedures have been delayed constitute the ‘first’ hidden burden associated with the need to clear ICUs during a long-lasting epidemic. The ‘second’ hidden burden concerns covid19 patients that were hospitalized but could not benefit from treatment in intensive care due to their progressive saturation.
Data, missing data and methods. We used data on daily ICU occupancy, and hospital bed occupancy from the Coordinated Sanitary Service of the Swiss Army (IES System). We used data on daily deaths (including hospital deaths, care homes death, and home-based death from covid19), and age of death attributable to covid19 from the Federal Office of Public Health. We used data on ICU patients’ age, and ICU patients SOFA scores from the RISC-ICU register (Dr Matthias Hilty). We used estimates of the median length of stay in ICU from the Swiss Society for Intensive Care Medicine (MDSi) database. An estimate of the average length of stay for ‘usual’ ICU patients (1.1 days) was estimated from this database, and provided by Prof. Hansueli Rothen. Data on the average length of stay of covid19 ICU patients was estimated from the RISC-ICU-register at 11 days. Data on covid19 attributable mortality in ICU could not be obtained at a national level. We estimated the baseline occupancy of ICU by non-covid19 patients, during the ‘quiet’ summer period (Between 01.06.2020 and 01.09.2020). The average number of non-covid patients in ICU during that period was 615. We estimated the time necessary to divide by two the number of covid19 patients in ICU (inverse of doubling time) from times series of ICU occupancy following the soft lockdown of March 17th 2020 using data from the coordinated sanitary service between March 28th and June 25th. The time necessary to divide by two the number of covid19 patients in ICU after lockdown was 17 days.
Results. In Switzerland, due to the second wave of covid19, 21,034 person-days of ICU attendance by non-covid patients have disappeared or been delayed. Assuming a median length of stay in ICU of 1.1 days per patient (MDSi database, see Data & Methods), this could amount to a backlog or first hidden burden of 19,121 patients who should have been admitted to ICU since October. We estimated the day when the occupancy of ICU could go back to a ‘normal situation’ where 70% of certified ICU beds would be allocated to non-covid patients, and 10% of certified ICU beds to covid19 patients. Working under the assumption that measures of comparable efficacy to the “soft lockdown’ of March would come into place on 07.01.2021, a normal situation would be reached at the earliest on the 10th of February 2021.
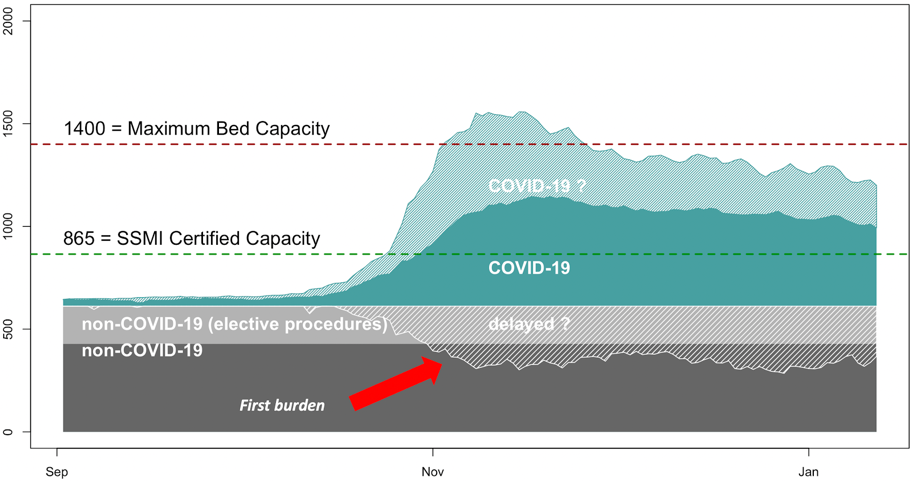
Figure 1. Occupancy of intensive care units in Switzerland since September 2020. Baseline occupancy by non covid19 patients (light grey: elective procedures, dark grey: non-elective procedures)), and covid19 patients (green). Grey dashed area illustrates the decrease in non covid19 patients on the ICU.
The second hidden burden of ICU patients. Between September and November 2020, the proportion of covid19 patients hospitalized into intensive care has declined. During the summer of 2020 the average percentage of covid19 hospitalized patients in intensive care was 22% (01.06.2020-01.09.2020). During the second wave, this percentage fell (10%), concomitantly with more than a doubling of the ratio of death/hospitalisation (Figure 2).
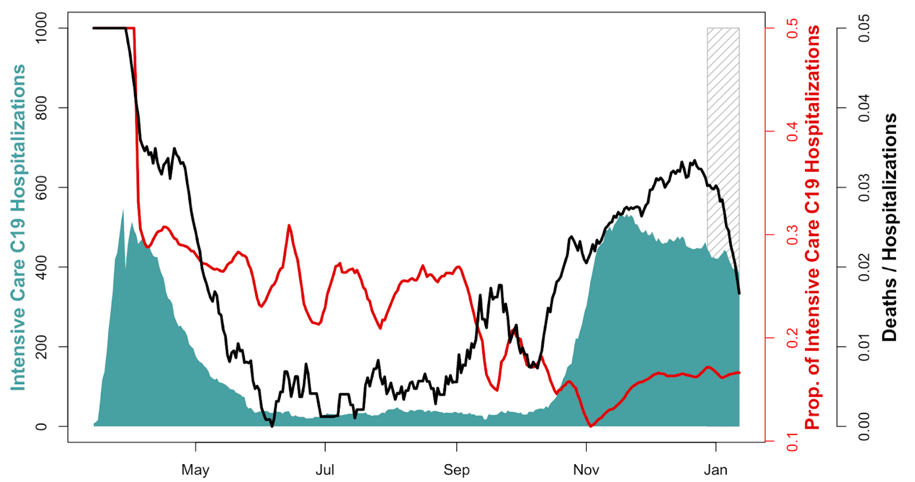
Figure 2. Number of covid19 patients in intensive care in Switzerland (green). Proportion of covid19 hospitalized patients in intensive care (red, 7 days average). Ratio of covid19 deaths to covid19 hospitalizations (black). Dashed grey lines indicate incomplete reporting of deaths due to end of year holidays.
We estimated the second hidden burden of ICU patients. This corresponds to the hypothetical occupancy of ICU if the ICU hospitalization rate of 22% observed during the summer had been maintained through autumn (Figure 3). Under that assumption, the additional number of covid19 patients in ICU could have reached 1,194, and the total number of patients in ICU exceeded the maximal capacity of beds in service.
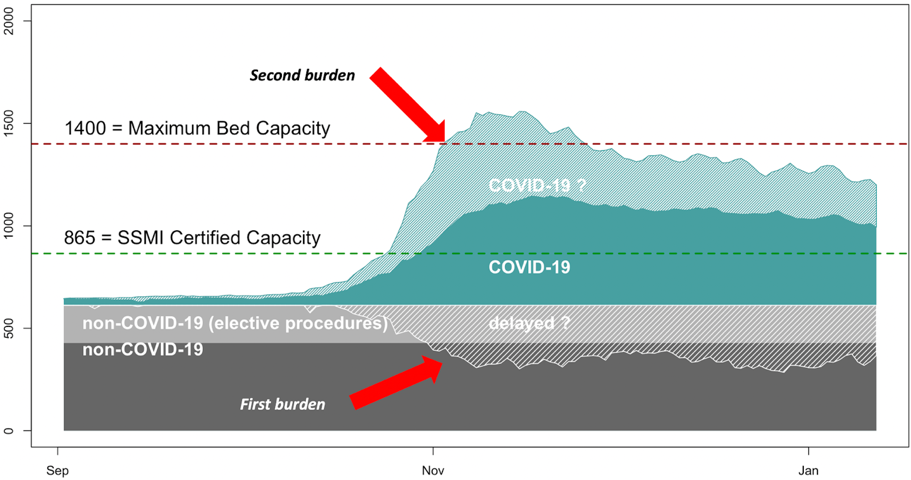
Figure 3. Occupancy of intensive care units in Switzerland since September 2020. Non-covid19 ICU patients (grey, including elective procedure light grey). Decrease in ICU occupancy from ‘usual’ patients (white dashes). Covid patients in intensive care units (green). Covid19 patients in intensive care units under the assumption of a rate of hospitalization in intensive care of 22% (summer average, green dashes).
Interpretation. We estimated for the first hidden burden, that procedures for 19,000 elective patients were delayed. In comparison, a news report published on 07.12.2020) highlighted that for two major hospitals (HUG and CHUV) 2,000 patients were currently on waiting lists for elective procedures, of which a majority is believed to be cardiovascular procedures and surgeries. HUG and CHUV account for just 10% of the ad-hoc intensive care bed capacity in Switzerland (09.12.2020). Similarly, in Basel, the university hospital estimated that 400 elective procedures may be delayed in 2020 for a bed capacity that represents 4% of the capacity of Switzerland (Manuel Battegay, personal communication). On January 7th, our estimate for the first hidden burden of ICU is consistent with these reports, assuming ICU hospitalization is involved for each procedure. Additionally, elective procedures not requiring ICU might have been delayed. These delays are not counted here. The interpretation of the potential second burden of ICU is more complex, and involves sometimes competing hypothesis.
Hypothesis 1. The uptake in the use of dexamethasone has increased recovery rates amongst hospitalized patients, and thus limit the need for hospitalization in intensive care. Under that hypothesis the uptake dexamethasone should also be reflected by a positive outcome on hospital mortality. However, the decline in the proportion of hospitalization of covid19 patients in intensive care was concomitant with an increase in the ratio of deaths to hospitalization (Fig 2, black line). This finding would tend to rule out hypothesis 1. However, it should be noted that we used overall death from covid19 to calculate the ratio of deaths to hospitalization. Unfortunately, there is to our knowledge no national database categorizing death between hospitals, elderly care homes, and deaths at home. .
Hypothesis 2. The decline in the proportion of hospitalization of covid19 patients in intensive care could be an immediate consequence from operating ever closer to saturation of ICUs. As of 13.11.2020 Switzerland has reached the capacity of beds certified by the SSMI (865 beds for adults, 12.01.2021 at 6pm). Working under the assumption that parameters on disease severity have not changed (see hypothesis 3), this could suggest that informal triage has taken place or that some patients were not hospitalized in ICU at their own request.
Hypothesis 3. The decrease in the proportion of hospitalization of covid19 patients in intensive care could be explained by an age shift in the patients hospitalized. Concretely, the drop would be attributed to the fact that younger patients are less likely to develop severe symptoms, and thus to require hospitalization in intensive care. However, between the first wave (prior 01.06.2020), and the second wave (after 15.10.2020) the mean age of death has increased from 82 to 84 years (Figure S2), while the age of admission to ICU was not significantly different between the two periods. These findings suggest that the age of patients is comparable between the two waves, but that amongst deceased patients, the proportion of old patients has increased. This finding is consistent with individual reports from Basel University Hospital (Manuel Battegay, personal communication). In parallel, the Sequential Organ Failure Assessment (SOFA scores) of ICU patients (RISC ICU Register) were lower during the second wave (10.24) than during the first wave (11.64; Figure S1). This suggests that patients hospitalized in ICU had comparatively less severe symptoms, or better treatment leading to less organ failure (hypothesis 1) than during the first wave.
Conclusion. Increase in the ratio of death to hospitalizations suggest that dexamethasone alone cannot explain the decrease in the proportion of Covid-19 patients admitted to ICU since September (hypothesis 1), because it should have been accompanied by a decrease in mortality. In addition, data on mean age of admission, and mean age of death do not support hypothesis 3 that the decrease in the proportion of covid19 patients admitted to ICU would be attributable to a shift in the age distribution of the epidemic. In fact, the increase in the age of death during the second wave suggests that a higher proportion of old patients died compared to the first wave. While patients admitted to ICU had less severe condition than during the first wave.
Hypothesis 2 appears more likely than hypothesis 1 and 3. This could suggest evidence for refusal of ICU admission by patients or informal triage, in which age may be an important criterion. Further clinical parameters such as severity scores should be used as controls to test hypothesis 2 (planned analysis with data from RISC-ICU). However, in the current context, it might be useful to inform decision makers about the risk of ‘double burden’ associated with high-levels of transmission since the excess in the need of ICU beds will not be detected by the ICU occupancy data we receive once ICUs are saturated. This happens to be the case today for the SGI ICU certified beds certified.
Limitations. As with any modeling study, our analysis comes with limitations. Our estimates of the first burden of ICU patients may not accurately reflect the impact on patient’s health. In particular, not all elective procedures are absolutely justified, and some cancellations may come at low health costs for those patients whose procedures were delayed, although these may still result in unnecessary harm over an extended period for the patients. Finally, underreporting of hospitalization in the IES system at the beginning of the second wave could have resulted in an underestimate of the ratio between hospitalization and ICU hospitalization on which our estimates of the second hidden burden of ICU patients was calculated.
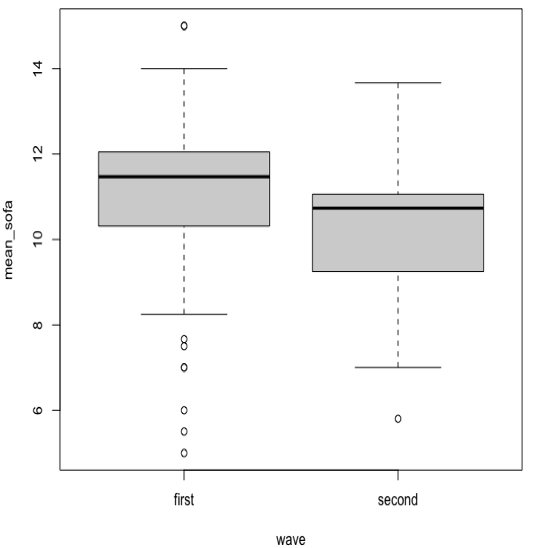
Figure S1. Comparison of the Sequential Organ Failure Assessment (SOFA scores) between the first and the second wave.
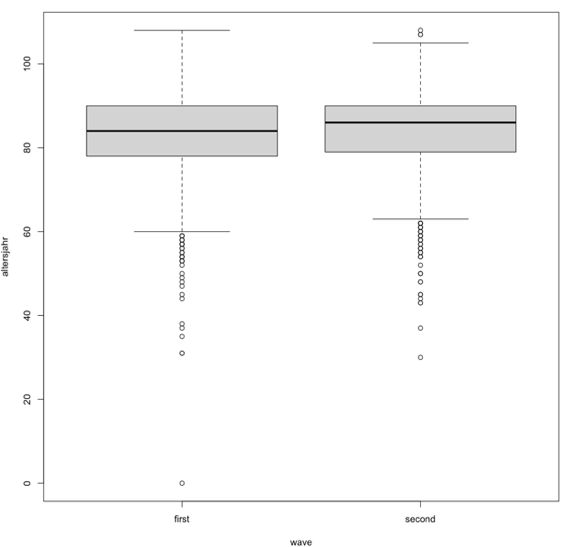
Figure S2. Comparison of the mean age of death between the first and the second wave.
Table S1. Proportion of patients in Intensive Care with covid19.
date Covid19 ICU (%)
2020-08-31 28.68
2020-09-01 26.92
2020-09-02 26.4
2020-09-03 26.09
2020-09-04 21.83
2020-09-05 21.99
2020-09-06 21.99
2020-09-07 23.45
2020-09-08 20.27
2020-09-09 20.95
2020-09-10 19.57
2020-09-11 18.12
2020-09-12 17.76
2020-09-13 17.76
2020-09-14 10.12
2020-09-15 10.78
2020-09-16 17.71
2020-09-17 16.2
2020-09-18 16.48
2020-09-19 16.38
2020-09-20 16.76
2020-09-21 17.99
2020-09-22 22.29
2020-09-23 19.34
2020-09-24 19.41
2020-09-25 23.12
2020-09-26 21.39
2020-09-27 21.39
2020-09-28 18.75
2020-09-29 17.68
2020-09-30 18.13
2020-10-01 18.62
2020-10-02 16.04
2020-10-03 16.3
2020-10-04 16.13
2020-10-05 18.32
2020-10-06 17.7
2020-10-07 17.06
2020-10-08 19.18
2020-10-09 17.84
2020-10-10 18.83
2020-10-11 18.37
2020-10-12 13.79
2020-10-13 15.09
2020-10-14 13.54
2020-10-15 14.07
2020-10-16 14.35
2020-10-17 15.25
2020-10-18 15.99
2020-10-19 16.32
2020-10-20 15.28
2020-10-21 15.82
2020-10-22 15
2020-10-23 16.14
2020-10-24 15.96
2020-10-25 14.74
2020-10-26 14.34
2020-10-27 13.89
2020-10-28 11.12
2020-10-29 11.57
2020-10-30 11.31
2020-10-31 11.85
2020-11-01 11.62
2020-11-02 10.98
2020-11-03 11.57
2020-11-04 12.06
2020-11-05 12.55
2020-11-06 13.17
2020-11-07 13.19
2020-11-08 12.3
2020-11-09 12.62
2020-11-10 13.17
2020-11-11 13.31
2020-11-12 13.63
2020-11-13 13.4
2020-11-14 13.87
2020-11-15 13.69
2020-11-16 13.96
2020-11-17 14.57
2020-11-18 14.83
2020-11-19 15.28
2020-11-20 16.07
2020-11-21 15.69
2020-11-22 15.6
2020-11-23 15.23
2020-11-24 15.44
2020-11-25 15.91
2020-11-26 15.99
2020-11-27 16.21
2020-11-28 16.3
2020-11-29 16.44
2020-11-30 15.86
2020-12-01 16.35
2020-12-02 17.2
2020-12-03 16.84
2020-12-04 16.7
2020-12-05 16.85
2020-12-06 16.01
2020-12-07 15.81
2020-12-08 15.83
2020-12-09 16.12
2020-12-10 16.82
2020-12-11 16.93
2020-12-12 16.6
2020-12-13 16.22
2020-12-14 16.27
2020-12-15 16.18
2020-12-16 16.73
2020-12-17 16.54
2020-12-18 16.45
2020-12-19 16.3
2020-12-20 15.93
2020-12-21 15.67
2020-12-22 16.01
2020-12-23 16.75
2020-12-24 17.46
2020-12-25 17.89
2020-12-26 17.59
2020-12-27 17.72
2020-12-28 16.69
2020-12-29 15.9
2020-12-30 15.99
2020-12-31 16.31
2021-01-01 16.53
2021-01-02 16.29
2021-01-03 15.99
2021-01-04 16.03
2021-01-05 16.41
2021-01-06 16.71
2021-01-07 17
2021-01-08 17.04
2021-01-09 16.59
2021-01-10 16.29
2021-01-11 16.43
2021-01-12 16.37
2021-01-13 16.7
2021-01-14 17.41
Date of request: –
Date of response: 12/01/2021
Experts involved: Thomas Van Boeckel, Thierry Fumeaux, Manuel Battegay, and supporting data from Matthias Hilty.
Contact persons: Thomas Van Boeckel