– Policy Brief
Executive summary
In October-November, the Romandy became a COVID19 hotspot in Switzerland and in Europe. Here we explore the reasons for this development by contrasting the development within different regions of Switzerland between mid-April and mid-November.
Confirmed case data suggests that the Romandy became a hotspot due to higher incidence at the end of summer compared to the rest of Switzerland, and not due to faster growth of the epidemic during fall. Case numbers in the first half of November decreased fastest in the Romandy where also the strictest measures were implemented.
The latest developments of the epidemic across regions are discussed in the Scientific Update (08.12.20).
The four cantons Vaud, Neuchatel, Geneva and Jura use French as the only official language and thus fully belong to the Romandy. The cantons Fribourg, Valais and Bern are officially bi-lingual (French and German). We perform analyses on the canton level below. In this document Fribourg and Valais are considered to be part of the Romandy, whilst Bern is not.
Additionally, we consider the seven greater regions of Switzerland. Romandy is part of Lake Geneva Region and Espace Mittelland. The other five regions are Eastern Switzerland, Northwestern Switzerland, Central Switzerland, Zurich, and Ticino.
All data presented in this document is publicly available data from the Federal Office of Public Health (confirmed case numbers) and the KOF Swiss Economic Institute (stringency).
Incidence in different regions through time
Confirmed case data indicates that Romandy had the highest incidence in late October.
We calculated the 7-day average of the number of confirmed cases / 100’000 for all cantons and the seven greater regions for Oct. 24-30. This time frame corresponds roughly to the Swiss-wide peak in confirmed cases in the second wave.
During Oct. 24-30, the six cantons with the highest average numbers of confirmed cases / 100’000 were Valais (210), Geneva (205), Fribourg (182), Jura (156), Neuchatel (153), and Vaud (134). Thus, the six Romandy cantons had the highest incidence at the peak of the second wave in Switzerland. Next in the list was Appenzell Innerrhoden (101). All other cantons had on average less confirmed cases per 100’000 inhabitants than the Swiss average (92) in that time period (see Table 1 for details).
Confirmed case data suggests that the Romandy had the highest incidence prior to the second wave.
We calculated the 7-day average of the number of confirmed cases / 100’000 for all cantons and greater regions for September 14-20.
Cantons with the highest incidence were Vaud (15.4), Geneva (11.4), Fribourg (6.8), Appenzell Innerrhoden (4.7), Bern (4.0), Neuchatel (3.8), and Valais (3.7). All other cantons had values below 3.5. Thus, five out of six Romandy cantons were among the seven cantons with the highest incidence prior to the second wave (see Table 1 for details).
For the same period of time, when looking at the seven greater regions, the two regions belonging (partly) to the Romandy were the regions with the highest incidence across Switzerland. The Lake Geneva region reported on average 11.7 and the Espace Mittelland 4.2 infections per 100’000 . All other regions reported a value <3.5.
Confirmed case data suggests that the Romandy had a higher incidence in June compared to the rest of Switzerland.
For the time period between the first and second wave, we determined for each canton and each greater region the minimal 7-day average incidence (per 100’000). For all regions, this minimum occurred in May or June (see Table 1 for details).
The highest minimum occurred in Vaud (0.20), Valais (0.18), Neuchatel (0.14), Geneva (0.13), Zurich (0.12), and Fribourg (0.12). All other cantons had values below 0.08 (Table 1). Thus, five out of the six Romandy cantons are among the six cantons with the highest minimum incidence between the two waves.
When looking at the seven greater regions, again the Lake Geneva Region had the highest minimum incidence (0.28), followed by Espace Mittelland (0.13).
Change of incidence in different regions
Based on confirmed case data, we see signs for a faster growth of the pandemic in the Romandy compared to some other regions over the summer.
Switzerland overall had the minimum 7-day average incidence on June 7. We considered the growth in incidence between that week and the week of September 14-20. The largest increase in incidence during that period of time occurred in Central Switzerland (47-fold), Eastern Switzerland (45) and the Lake Geneva Region (42). The other regions had a smaller increase compared to the Swiss average (30). Again, see Table 1 for details.
We note that due to the low numbers of confirmed cases in June, these point estimates for the growth of the incidence are associated with substantial uncertainty. We now further consider the effective reproductive number Re in July and August in the different regions taking into account the uncertainty.
For July, two regions reported an Re significantly above 1: the Lake Geneva Region (1.17 [1.11,1.24]) and Zurich (1.10 [1.02,1.18]), see Table 2). Ticino had a significantly slower spread compared to the Lake Geneva Region. For August, the Espace Mittelland, the Lake Geneva Region, and Zurich reported an Re significantly above 1. Central Switzerland and Northwestern Switzerland reported a significantly slower spread compared to the Lake Geneva Region and the Espace Mittelland.
In summary, we see signs for a faster growth of the pandemic over summer in the Romandy compared to some other regions. We note that it is not possible to reliably compare all regions with each other, due to the small case number (and thus high uncertainty) in some regions.
Based on confirmed case data, we see signs for a slower growth of the pandemic in the Romandy compared to the rest of Switzerland in the fall.
Case numbers started to increase rapidly across Switzerland in late September. We computed the ratio of the incidence in late October and the incidence in mid September to compare the growth rate of the epidemic during the second wave across cantons.
In that time period, the number of confirmed cases / 100’000 increased most in Uri (151-fold), followed by Nidwalden (137), Ticino (80), Schwyz (76), Jura (70), and Valais (57). Thus, the fastest-growing cantons from the Romandy only came fifth and sixth in the list of growth rates during the second wave.
When looking at the greater regions, Ticino increased most (80-fold), followed by Central Switzerland (44-fold). The Lake Geneva Region had in fact the slowest growth rate (15-fold) of the seven greater regions in Switzerland. Again, see Table 1 for further details.
This observation for the greater regions is also confirmed by the estimates of the effective reproductive number Re for the greater regions (https://ibz-shiny.ethz.ch/covid-19-re/). All greater regions showed the same trend in Re. We observe first an increase in Re during the second half of September. After reaching a peak at the end of September, the Re values declined continuously. The peak in Re was highest for Ticino and Central Switzerland (see Figure 1 and https://ibz-shiny.ethz.ch/covid-19-re/), i.e., the regions with the largest increase in incidence (see Table 1).
Trends in confirmed cases suggest that the Romandy had the fastest decline in confirmed cases in November.
We calculated the effective reproductive number Re for November 10, i.e. when Re was at a low point prior to increasing again in the second half of November (Table 3; data taken from https://ibz-shiny.ethz.ch/covid-19-re/ on Dec. 6). All and only the six cantons in the Romandy had on November 10 a value of Re significantly below 0.81. Five of these cantons (exception is Jura) are significantly below the target value of 0.8 proposed by the Science Task Force. Three more cantons reported a point estimate of Re below 0.8, albeit with a large uncertainty interval containing 0.8 (Appenzell Innerhoden, Glarus, Nidwalden). The latter two cantons had much lower peak incidence compared to the Romandy. Absence of significance may be due to smaller case numbers.
The stringency of the measures in place on November 10 tended to be higher in the Romandy compared to the rest of Switzerland.
We now consider the stringency of measures on November 10. In Table 4, we show the Oxford stringency index as calculated for all cantons by the KOF Swiss Economic Institute (latest data available on https://kofdata.netlify.app/; we use the stringency_plus value, download on Dec. 7, 2020). On November 10, the six Romandy cantons were among the eight cantons with the highest stringency (Table 4, left). We recall that these six Romandy cantons are the only cantons with an Re significantly below 0.81. The two cantons in the list of eight report the following Re values for November 10: Bern 0.83 [0.79,0.88], Aargau 0.93 [0.87,1.00].
On October 20, when the Re for Switzerland was still larger than 1 but on the decline, four cantons had higher stringency of the measures compared to the stringency of national measures put in place by the Bundesrat. Two of the four cantons are in the Romandy (Vaud, Valais, plus Ticino and Zurich). On September 25, around the time when transmission rates were highest (i.e., the value of Re peaked), ten cantons had higher stringency compared to the stringency of the national measures. Five of these cantons belong to Romandy (Table 4).
Interestingly, Ticino and Zurich were among the four cantons with the highest stringency on October 20 and among the ten cantons with the highest stringency on September 25. Ticino had the third-highest growth rate across cantons in the second wave, while only five cantons had a slower growth compared to Zurich.
Summary
We do not have indications that the rate of growth of the epidemic during the second wave in the Romandy was faster than in other parts of Switzerland. In fact, confirmed case data suggests that the epidemic spread was slower on average in the Romandy than in the rest of Switzerland. Our analyses suggest that the higher incidence at the end of the summer in the Romandy compared to the rest of Switzerland was the reason why the Romandy became a hotspot in the fall, during the second wave.
Confirmed case data suggests that this higher incidence at the end of summer may have been due to a higher incidence in the Romandy after the first wave (i.e., in June), together with a slightly faster growth of the epidemic during the summer. Due to the small number of confirmed cases between the two waves, it is difficult to reach a definitive conclusion regarding the reason for the higher incidence in the Romandy compared to the rest of Switzerland at the end of the summer. We envision that additional analyses comparing incidences within bi-lingual cantons will shed further light on the reasons for a higher incidence at the end of the summer in the six cantons which we defined as the Romandy.
Around November 10, the Re estimated based on confirmed cases reached a low point before increasing again in the second half of November. For November 10, our data suggests that the Romandy had the fastest decline in the epidemic across Switzerland while having on average the strictest measures.
In general, throughout the epidemic, some cantons had at times stringency of measures above the national measures. Transmission rates are determined by a combination of the stringency of the measures and the compliance to the measures. Further analyses are required to evaluate if the same stringency would result in the same growth rates across regions or if there is variability in how measures are put into practice across regions.
We emphasize that all considerations are based on the confirmed case numbers. The hidden number of infections may vary through time and across regions. Thus, while we argue that observed trends are informative, we advise against overinterpreting quantitative results.
The number of confirmed cases was the least delayed indicator for monitoring the epidemic situation in the fall in Switzerland. However, confirmed cases only reflect the transmission dynamics with a delay of more than a week (due to the time from infection to case confirmation). Thus, we only see a significant upward trend in the epidemic about two weeks after the epidemic started increasing. If incidence is already elevated prior to the onset of the upward trend, a very fast reaction is required once the upward trend is seen in order to prevent a region from becoming a hotspot. For the Romandy, we suggest that transmission during the second wave was not faster than elsewhere in Switzerland. Instead, elevated incidence compared to other Swiss regions at the end of the summer explains why the Romandy became a hotspot in Switzerland in the fall.
date minimal mean incidence | 7day mean incidence / 100’000 | ratios | |||||
Region | minimal | 07.06.20 | 20.09.20 | 30.10.20 | 20.9. / 7.6.2020 | 30.10. / 20.9.2020 | |
Central Switzerland | 30.05.20 | 0.03 | 0.03 | 1.45 | 64.13 | 47.00 | 44.37 |
LU | 30.05.20 | 0.03 | 0.03 | 1.83 | 63.15 | 60.00 | 34.48 |
UR | 27.05.20 | 0.00 | 0.00 | 0.34 | 51.81 | Inf | 151.00 |
SZ | 19.05.20 | 0.00 | 0.00 | 1.10 | 84.03 | Inf | 76.43 |
OW | 10.05.20 | 0.00 | 0.00 | 1.65 | 53.18 | Inf | 32.20 |
NW | 23.05.20 | 0.00 | 0.00 | 0.29 | 39.62 | Inf | 137.00 |
ZG | 30.05.20 | 0.00 | 0.10 | 1.28 | 57.46 | 13.00 | 44.85 |
Eastern Switzerland | 06.06.20 | 0.04 | 0.05 | 2.40 | 66.37 | 45.20 | 27.64 |
GL | 16.05.20 | 0.00 | 0.00 | 1.86 | 53.21 | Inf | 28.67 |
SH | 15.05.20 | 0.00 | 0.15 | 1.22 | 46.80 | 8.00 | 38.38 |
AR | 21.05.20 | 0.00 | 0.00 | 2.49 | 70.83 | Inf | 28.45 |
AI | 01.05.20 | 0.00 | 0.00 | 4.65 | 100.65 | Inf | 21.67 |
SG | 26.05.20 | 0.00 | 0.05 | 3.23 | 79.53 | 65.50 | 24.66 |
GR | 18.06.20 | 0.00 | 0.06 | 1.13 | 52.74 | 18.00 | 46.50 |
TG | 12.06.20 | 0.00 | 0.05 | 2.08 | 56.83 | 46.00 | 27.33 |
Espace Mittelland | 01.06.20 | 0.13 | 0.19 | 4.18 | 95.70 | 21.62 | 22.92 |
BE | 19.06.20 | 0.07 | 0.11 | 3.97 | 68.17 | 36.56 | 17.16 |
FR | 01.06.20 | 0.12 | 0.47 | 6.75 | 181.82 | 14.33 | 26.95 |
SO | 27.05.20 | 0.05 | 0.09 | 2.75 | 46.40 | 30.00 | 16.90 |
NE | 28.05.20 | 0.14 | 0.42 | 3.75 | 152.74 | 8.83 | 40.77 |
JU | 15.05.20 | 0.00 | 0.00 | 2.21 | 155.95 | Inf | 70.46 |
Lake Geneva Region | 07.06.20 | 0.28 | 0.28 | 11.74 | 171.57 | 41.70 | 14.61 |
VD | 01.06.20 | 0.20 | 0.25 | 15.44 | 133.97 | 61.69 | 8.68 |
VS | 24.05.20 | 0.18 | 0.40 | 3.67 | 210.46 | 9.18 | 57.34 |
GE | 14.06.20 | 0.13 | 0.25 | 11.39 | 204.96 | 45.50 | 18.00 |
Northwestern Switzerland | 10.06.20 | 0.10 | 0.14 | 2.15 | 48.69 | 15.38 | 22.62 |
BS | 26.06.20 | 0.00 | 0.26 | 1.54 | 42.81 | 6.00 | 27.79 |
BL | 23.05.20 | 0.00 | 0.13 | 0.82 | 40.78 | 6.33 | 49.47 |
AG | 10.06.20 | 0.07 | 0.11 | 2.89 | 53.74 | 26.17 | 18.57 |
Ticino | 11.06.20 | 0.04 | 0.07 | 1.10 | 87.98 | 15.50 | 80.23 |
TI | 11.06.20 | 0.04 | 0.07 | 1.10 | 87.98 | 15.50 | 80.23 |
Zurich | 23.05.20 | 0.12 | 0.15 | 3.47 | 66.55 | 23.44 | 19.19 |
ZH | 23.05.20 | 0.12 | 0.15 | 3.47 | 66.55 | 23.44 | 19.19 |
CHE | 07.06.20 | 0.16 | 0.16 | 4.60 | 91.68 | 29.69 | 19.91 |
Table 1. Incidence per 100’000 across cantons and greater regions in late October (7-day average, October 24-30), mid-September (7-day average, Sep 14-20), and early June (7-day average, June 1-7). Further, we state the minimal 7-day average incidence per 100’000 between the first and second wave. Finally, we state the magnitude of change with ratio = 7-day average on September 20 / 7-day average on June 6; and ratio = 7-day average on October 30 / 7-day average on September 20).
| July | August | ||||
Re | lower bound | upper bound | Re | lower bound | upper bound | |
Switzerland | 1.11 | 1.08 | 1.15 | 1.13 | 1.11 | 1.15 |
Central Switzerland | 1.04 | 0.92 | 1.17 | 1.00 | 0.91 | 1.10 |
Eastern Switzerland | 1.10 | 0.99 | 1.21 | 1.06 | 0.98 | 1.15 |
Espace Mittelland | 1.09 | 0.99 | 1.19 | 1.19 | 1.13 | 1.25 |
Lake Geneva Region | 1.17 | 1.11 | 1.24 | 1.18 | 1.14 | 1.22 |
Northwestern Switzerland | 1.05 | 0.96 | 1.15 | 1.05 | 0.98 | 1.12 |
Ticino | 0.91 | 0.71 | 1.11 | 1.05 | 0.87 | 1.25 |
Zurich | 1.10 | 1.02 | 1.18 | 1.10 | 1.05 | 1.15 |
Table 2. Re estimates for the greater regions in Switzerland for July and for August.
| Re | lower bound | upper bound |
GE | 0.57 | 0.54 | 0.60 |
FR | 0.57 | 0.53 | 0.61 |
Lake Geneva Region | 0.61 | 0.59 | 0.63 |
VD | 0.64 | 0.61 | 0.67 |
VS | 0.66 | 0.61 | 0.71 |
NE | 0.67 | 0.60 | 0.74 |
Espace Mittelland | 0.72 | 0.70 | 0.75 |
CH | 0.74 | 0.73 | 0.75 |
JU | 0.67 | 0.55 | 0.80 |
BE | 0.83 | 0.79 | 0.88 |
TI | 0.82 | 0.76 | 0.88 |
Ticino | 0.82 | 0.76 | 0.89 |
Zurich | 0.89 | 0.85 | 0.93 |
Eastern Switzerland | 0.89 | 0.84 | 0.93 |
ZH | 0.89 | 0.85 | 0.93 |
SG | 0.87 | 0.82 | 0.93 |
LU | 0.87 | 0.80 | 0.95 |
Central Switzerland | 0.91 | 0.85 | 0.96 |
SO | 0.88 | 0.78 | 0.97 |
TG | 0.89 | 0.79 | 0.99 |
AG | 0.93 | 0.87 | 1.00 |
NW | 0.74 | 0.52 | 1.00 |
Northwestern Switzerland | 0.97 | 0.92 | 1.01 |
GL | 0.78 | 0.54 | 1.05 |
SZ | 0.93 | 0.79 | 1.08 |
ZG | 0.94 | 0.80 | 1.10 |
BS | 0.99 | 0.88 | 1.10 |
GR | 0.98 | 0.87 | 1.11 |
AR | 0.90 | 0.71 | 1.11 |
AI | 0.72 | 0.41 | 1.11 |
BL | 1.03 | 0.93 | 1.14 |
SH | 0.99 | 0.82 | 1.18 |
OW | 0.94 | 0.73 | 1.19 |
UR | 1.16 | 0.89 | 1.47 |
Table 3. Re across cantons for November 10. The table is sorted with increasing upper bound of the Re estimate.
10.11.20 | 20.10.20 | 25.09.20 | |||
GE | 63.33 | TI | 49.17 | VD | 49.17 |
JU | 63.33 | VD | 49.17 | BS | 41.67 |
NE | 63.33 | ZH | 49.17 | JU | 41.67 |
VD | 63.33 | VS | 47.5 | NE | 41.67 |
AR | 60.83 | AG | 44.17 | TI | 41.67 |
BE | 60.83 | AI | 44.17 | FR | 39.17 |
FR | 60.83 | AR | 44.17 | LU | 39.17 |
VS | 60.83 | BE | 44.17 | VS | 39.17 |
SO | 60 | BL | 44.17 | ZG | 39.17 |
TI | 60 | BS | 44.17 | ZH | 39.17 |
AG | 57.5 | CH | 44.17 | AG | 36.67 |
AI | 57.5 | FR | 44.17 | AI | 36.67 |
BL | 57.5 | GE | 44.17 | AR | 36.67 |
BS | 57.5 | GL | 44.17 | BE | 36.67 |
CH | 57.5 | GR | 44.17 | BL | 36.67 |
GL | 57.5 | JU | 44.17 | CH | 36.67 |
GR | 57.5 | LU | 44.17 | GE | 36.67 |
LU | 57.5 | NE | 44.17 | GL | 36.67 |
NW | 57.5 | NW | 44.17 | GR | 36.67 |
OW | 57.5 | OW | 44.17 | NW | 36.67 |
SG | 57.5 | SG | 44.17 | OW | 36.67 |
SH | 57.5 | SH | 44.17 | SG | 36.67 |
SZ | 57.5 | SO | 44.17 | SH | 36.67 |
TG | 57.5 | SZ | 44.17 | SO | 36.67 |
UR | 57.5 | TG | 44.17 | SZ | 36.67 |
ZG | 57.5 | UR | 44.17 | TG | 36.67 |
ZH | 57.5 | ZG | 44.17 | UR | 36.67 |
Table 4. Oxford stringency index for the different cantons for November 10, 2020, Oct. 20, 2020, and September 25 as calculated by KOF Swiss Economic Institute.
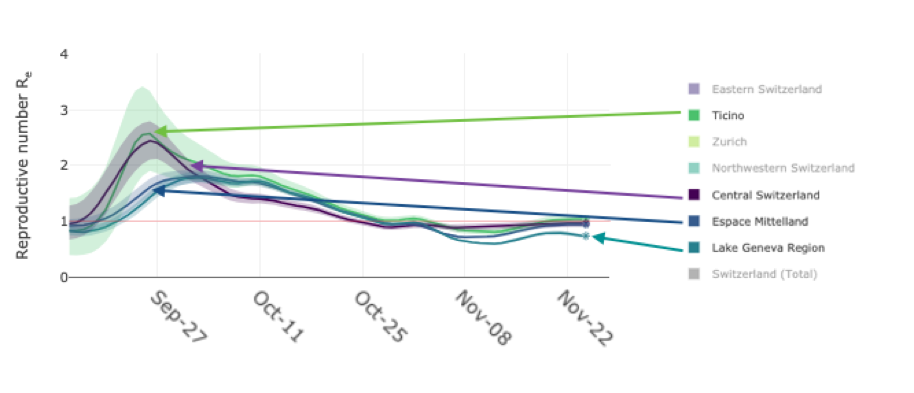
Figure 1. Re for four out of seven greater regions in Switzerland. The peak in Re was higher in Central Switzerland and Ticino compared to the Romandy regions. All seven regions can be viewed on https://ibz-shiny.ethz.ch/covid-19-re/.
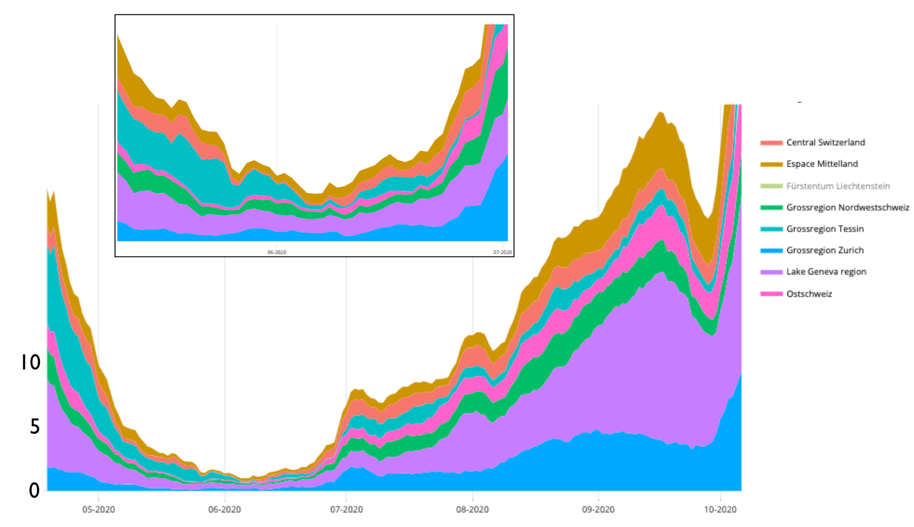
Figure 2. Incidence per 100’000 averaged over 7 days across the seven greater regions from mid-April to early October. In the insert, we zoom into the time between mid-May and end of June.
Date of request: –
Date of response: 08/12/2020
Experts involved: Tanja Stadler, expert group Data and Modelling, expert group Economics, expert group leaders
Contact persons: Tanja Stadler